Monitoring vs Observability: Differences & Which to Use
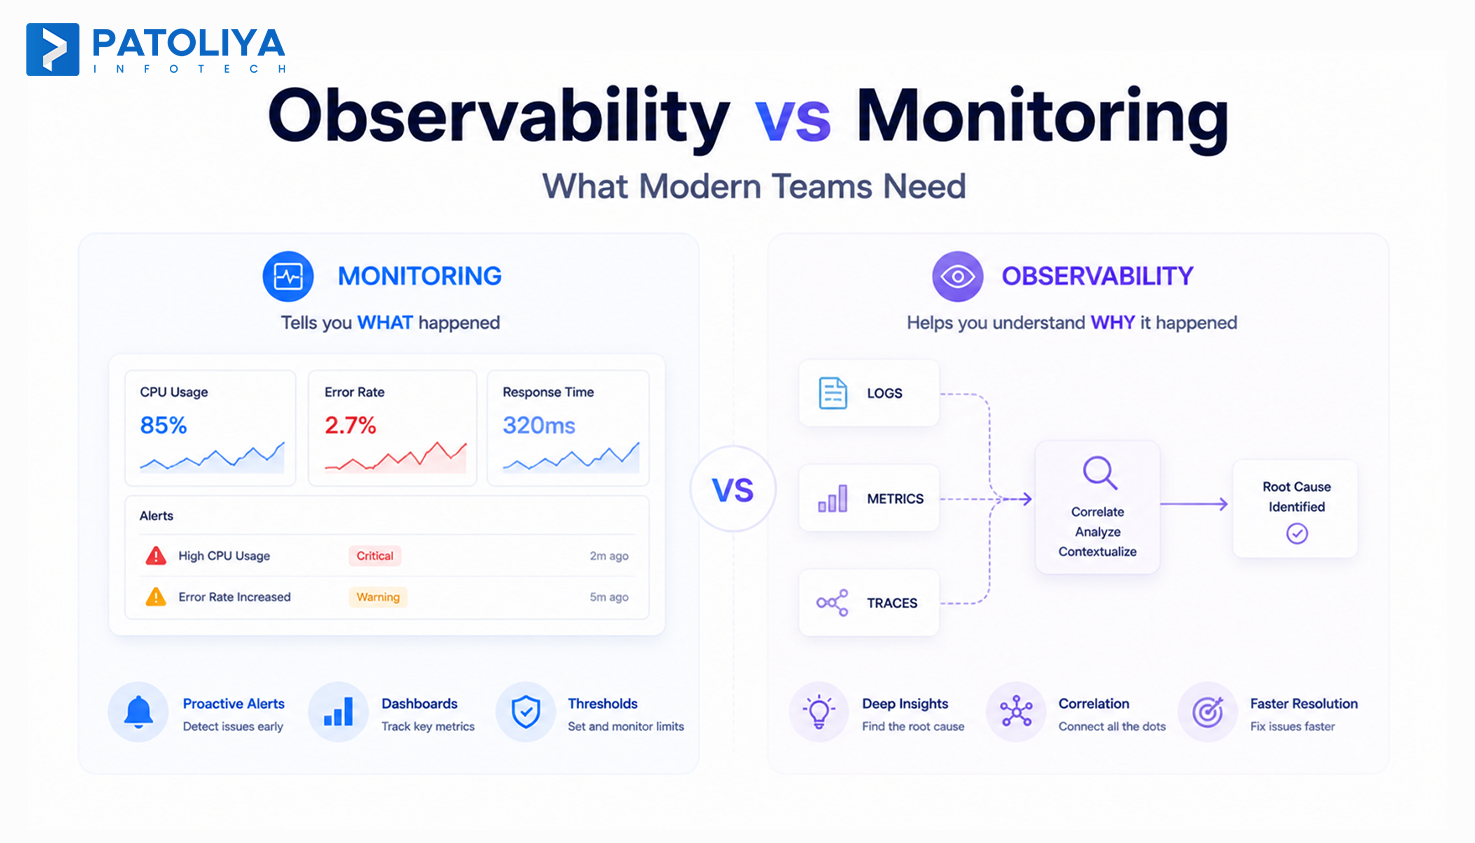
Table of Contents
TLDR: Observability vs monitoring is not a choice between two tools; it is the difference between knowing a fire exists and knowing what started it. Monitoring tells you something broke. Observability tells you why. Engineering teams running distributed systems need both to cut downtime and reduce MTTR.
Unplanned downtime costs enterprises an average of $5,600 per minute, yet most engineering teams treat alerts as their primary debugging strategy. That gap is exactly where observability vs monitoring stops being theoretical and starts costing real money.
Traditional monitoring threshold alerts, uptime checks, and predefined dashboards were built for monolithic applications where failures were predictable. Microservices, Kubernetes, and cloud-native stacks broke that assumption completely.
This guide defines observability vs monitoring, maps their functional differences, evaluates tooling, and gives engineering leads a vendor selection framework. By the end, you will know exactly which approach your stack requires and how to build a production-grade pipeline without rearchitecting from scratch.
What Is Observability vs Monitoring?
Observability vs monitoring addresses two different engineering questions. Monitoring asks whether the system is behaving as expected, while observability explains why it is not.
What is Monitoring?
Monitoring tracks predefined signals such as CPU usage, error rates, and uptime. It triggers alerts when thresholds are exceeded, for example, indicating that a payment service is down. However, it does not identify the root cause or the upstream dependency responsible for the failure.
What is Observability? The Three Pillars
Observability works through logs, metrics, and traces together. Logs capture what happened at a specific time, metrics show system-wide performance trends, and traces follow the complete path of a request across services.
Observability vs Monitoring in Practice
When a checkout fails, monitoring triggers a 500 error alert. With observability vs monitoring, trace data shows the failure originated in the inventory service, reducing debugging time.
Core Capabilities: What Observability Actually Does
Observability vs monitoring diverges most visibly at the capability level. Monitoring gives you a dashboard. Software observability tools give you an investigation surface.

Distributed Tracing: Request Lifecycle Across Services
Distributed tracing follows a single request across every service it touches. For instance, a payment fails. In observability vs monitoring, Monitoring shows a 500 error on the payments service. Distributed tracing shows the actual sequence. The auth service responded in 2ms, inventory lookup took 4.2 seconds, and payments timed out waiting. That single trace cuts a 45-minute debugging session to under five minutes.
Structured Logging and Log Correlation
Unstructured logs become noise at scale. Structured logging tags every event with request ID, user ID, and service name. Combined with distributed tracing, those tags link log lines across six services into one readable sequence automatically.
High-Cardinality Metrics
In observability vs monitoring, Standard monitoring tracks CPU and error rates. Software observability tools track per-tenant latency, per-endpoint failure rates, and per-user session errors. That granularity is what surfaces the bug affecting only enterprise accounts in the EU region, invisible to standard monitoring.
OpenTelemetry Setup as the Foundation
A proper OpenTelemetry setup instruments once and feeds every backend, Prometheus, Grafana, Datadog, or Jaeger without rewriting instrumentation. Teams that skip a standardized OpenTelemetry setup pay the migration cost later, usually during a vendor switch under pressure in observability vs monitoring. Many organizations adopt structured DevOps Consulting practices to standardize observability pipelines, distributed tracing, and cloud-native monitoring workflows across services.
SRE Observability and Error Budgets
SRE observability ties this data to business commitments. Monitoring alerting pipelines built on the error budget burn rates page, your team when reliability is degrading meaningfully, not every time a single request fails.
Real Operational Problems Observability Solves
The observability vs monitoring gap stops being theoretical the moment you hit one of these four failure patterns in production.
Intermittent Failures Below Alert Thresholds
A service failing 0.3% of requests never triggers a 1% error rate alert. Across five million daily transactions, that is 15,000 failed user sessions your monitoring stack never sees. In observability vs monitoring, Software observability tools with distributed tracing catch this because they record individual request journeys, not just aggregated counts. You find it in trace data before it appears in support tickets.
MTTR Exceeding 45 Minutes
Observability vs monitoring becomes a postmortem conversation when incidents run long. A distributed failure with monitoring-only data forces engineers to manually reconstruct what happened across services. Trace context makes that reconstruction instant one timeline, every service, exact sequence. Teams with full distributed tracing consistently report 40 to 60% MTTR reduction within the first quarter of deployment.
Kubernetes Metric Explosion
Kubernetes generates thousands of metrics per node. Monitoring platforms drop data or charge heavily to retain it. In observability vs monitoring, Software observability tools handle this through intelligent sampling and distributed tracing that keeps focus on request paths that matter.
Distributed System Debugging Without Trace Context
Without trace IDs propagating across service boundaries, debugging a six-service failure means six separate log investigations. Distributed tracing collapses that into one readable timeline, the same reason teams that try it rarely go back to monitoring-only debugging
Observability vs Monitoring: Market Context and Tool Comparison
The observability vs monitoring tooling market has split as distributed architectures became standard. Knowing where vendors truly fit helps avoid costly mis-purchases that fail in production.
The Observability Market in 2026-2027
Metrics-first tools now add logs and traces, while observability platforms like Datadog, Honeycomb, and Grafana Cloud expand into incident management and AIOps.
Convergence exists, but architecture defines capability. In observability vs monitoring, a metrics-first tool adding traces is not equal to a tracing-first platform built for distributed systems.
Open-Source Stack vs. Commercial Platforms
| Criteria | Open-Source Stack | Commercial Platform |
| Upfront cost | Low | Medium to High |
| Operational overhead | High | Low |
| OpenTelemetry setup support | Native | Native |
| Distributed tracing backend | Jaeger, Tempo | Vendor-managed |
| Customization | Full | Limited |
| Best for | Teams with SRE bandwidth | Teams prioritizing speed |
The open-source observability vs monitoring path has low licensing cost but high labor cost. Running Prometheus Grafana, Jaeger, and Loki cohesively in production takes dedicated SRE time that commercial software observability tools absorb for you through managed infrastructure.
When Monitoring Alone Is Sufficient
Not every system needs full observability vs monitoring investment. A single-service application with predictable traffic and no external SLAs runs effectively on monitoring alone. The threshold for investing in software observability tools is roughly: three or more services, external-facing SLAs, or more than two engineers responding to monthly incidents.
A quick way to decide:
- More than five microservices? Add distributed tracing.
- MTTR above 30 minutes for P1s? Software observability tools pay back fast.
- Running Kubernetes? A proper OpenTelemetry setup is non-negotiable.
- Single monolith, stable traffic? Monitoring is sufficient for now.
Monitoring-Only Tools: Where They Break
Tools like basic CloudWatch alarms lack trace context, high-cardinality query support, and cross-service correlation. In any observability vs monitoring evaluation, they answer only "that it failed." That gap is manageable with one service. With ten, it becomes the reason your incidents run long.
Pricing and Cost Breakdown
Cost is where observability vs monitoring decisions get real. Most budget conversations undercount implementation costs by focusing only on licensing.
Open-Source Implementation Cost Tiers
| Tier | Stack | Monthly Infra | Engineering Hours |
| Basic | Prometheus + Grafana | $200 to $800 | 80 to 120 hrs |
| Standard | Above + Loki + Jaeger | $800 to $2,500 | 200 to 300 hrs |
| Full | Above + OpenTelemetry setup | $2,500 to $6,000 | 400 to 600 hrs |
Commercial SaaS Observability Platform Costs
Software observability tools cost $15 to $80 per host monthly. Enterprise contracts with full distributed tracing frequently exceed $100K annually.
Hidden Costs Teams Consistently Underestimate
Three costs show up late in almost every observability vs monitoring implementation:
Cardinality overruns. One poorly-scoped label multiplies data volume 3 to 5x. Shows up at renewal, not onboarding.
Retention gaps. 90 days of traces costs more than teams expect when they accept vendor default settings without reviewing volume projections first.
Training time. A new OpenTelemetry setup needs at least one engineer who understands collector configuration and sampling strategy. That gap adds 4–6 weeks.
Contract Models and Engagement Types
Fixed-scope works best for greenfield OpenTelemetry setup delivery. Time-and-materials fits migrations. Retainer models suit teams where the distributed tracing configuration evolves continuously with the service mesh.
ROI and Business Impact of Observability
The ROI of observability vs monitoring comes down to measurable impact across reliability, productivity, cost, and scale. These gains can be estimated before implementation.

MTTR Reduction
The strongest ROI driver is faster incident resolution. If MTTR drops from 90 minutes to 25 minutes using software observability tools with distributed tracing, the time saved directly reduces downtime cost. In observability vs monitoring, Many teams recover investment within 6–12 months through MTTR improvement alone.
Developer Productivity
In observability vs monitoring, without software observability tools, engineers spend excessive time debugging. Reducing investigation time from 45 minutes to under 10 minutes frees real sprint capacity. Across teams handling frequent incidents, this translates into weeks of recovered development time.
Infrastructure Optimization
In observability vs monitoring, observability enables deeper cost insights. Trace data highlights inefficient services and resource overuse. Teams often identify 15 to 25% savings through better resource allocation and removal of redundant services.
Scalability Economics
Monitoring-heavy setups require scaling teams with system growth. In observability vs monitoring, Observability changes this. With distributed tracing and SLO-based alerts, smaller SRE teams can manage significantly larger systems, improving operational efficiency as systems scale.
Risks and Challenges in Implementing Observability
Implementing observability vs monitoring introduces real risks that must be addressed early.
Data Privacy and PII in Distributed Traces
- Distributed tracing captures request-level data, including user IDs and payloads.
- Compliance with GDPR, HIPAA, and SOC 2 requires trace scrubbing pipelines.
- Privacy controls should be built during OpenTelemetry setup, not retrofitted later.
Instrumentation Debt and Maintenance Overhead
- Every service requires consistent instrumentation and updates.
- Missing instrumentation creates blind spots in software observability tools of observability vs monitoring.
- Treating OpenTelemetry setup as a one-time task leads to incomplete observability.
Cardinality Explosion and Storage Costs
- High-cardinality metrics increase storage and cost significantly.
- Uncontrolled labels can multiply metric volume across systems.
- Governance policies are essential in observability vs monitoring to control cost.
Vendor Lock-In with Commercial Observability Platforms
- Proprietary agents and query languages increase switching complexity.
- Vendor dependency limits flexibility across observability platforms.
- A standards-based OpenTelemetry setup keeps instrumentation vendor-neutral and reduces lock-in risk.
Vendor Selection Checklist: 10 Point Evaluation Framework
Evaluating software observability tools on demo quality alone is how teams end up with platforms that fail in production. Work through these before any vendor conversation for observability vs monitoring.
- Does the platform support native OpenTelemetry setup without proprietary agents?
- Does distributed tracing support tail-based sampling at the collector level?
- What are cardinality limits and overage pricing structures?
- How does the platform handle PII scrubbing in trace data?
- Does distributed tracing correlate with logs and metrics in a single query surface?
- What is the data retention policy at your expected volume?
- Does the vendor offer SLO-based alerting with error budget burn rates?
- What is the migration path if you need to switch backends?
- Are there case studies from teams with comparable service counts?
- What does OpenTelemetry setup support look like, community only, or dedicated SRE access?
Top Observability Implementation Partners: Company Profiles
Choosing the right observability vs monitoring implementation partner shapes your architecture decisions and how fast you reach production-grade reliability. Here are four worth evaluating.
Patoliya Infotech
Patoliya Infotech delivers end-to-end observability vs monitoring implementations for teams running 10 to 50 microservices. Engagements are fixed-scope with defined timelines.
- Full OpenTelemetry setup from collector configuration to backend routing.
- Distributed tracing architecture designed for your actual service topology.
- Software observability tools integration across open-source and commercial stacks.
- Compliance-aware trace scrubbing for GDPR, HIPAA, and SOC 2 is built in from day one.
Best for: Teams that need production-ready observability vs monitoring without figuring out the architecture themselves.
Typical timeline: 4 to 10 weeks.
Infracloud
Infracloud brings CNCF ecosystem depth to observability vs monitoring in Kubernetes-native environments. Strong OpenTelemetry setup and distributed tracing capabilities for teams where standard monitoring platforms buckle under metric volume.
- Open-source software observability tools implementation using Jaeger, Tempo, and Loki.
- Service mesh observability for Istio and Linkerd environments.
Best for: Teams migrating from legacy monitoring into cloud-native stacks.
Typical timeline: 6 to 14 weeks.
Cloudreach (Atos)
Cloudreach focuses on enterprise-scale software observability tools implementation inside regulated industries where compliance shapes every distributed tracing architecture decision.
- GDPR and HIPAA-aware OpenTelemetry setup with data residency controls.
- Observability vs monitoring across hybrid and multi-cloud environments.
Best for: Enterprise teams in financial services, healthcare, or the public sector.
Typical timeline: 3 to 6 months.
Contino
Contino embeds observability vs monitoring into broader platform engineering programs. OpenTelemetry setup and distributed tracing become default capabilities across every product team, not a one-time project.
- Software observability tools are built into the internal developer platform's golden paths.
- SLO and error budget frameworks tied to business reliability commitments.
Best for: Organizations scaling observability vs monitoring across multiple product teams.
Typical timeline: 3 to 9 months.
Why Patoliya Infotech for Observability Implementation
Patoliya Infotech approaches observability vs monitoring as an engineering problem, not a tooling sale. A modern software development company must design observability systems that scale with cloud-native infrastructure and microservices growth. The difference shows in how engagements are scoped.
- Scoped OpenTelemetry setup delivery with defined timelines, no open-ended statements of work.
- Distributed tracing architecture designed for your actual service topology, not a generic reference implementation.
- Software observability tools selection based on your team's operational maturity and budget, not vendor partnerships.
Production-ready observability vs monitoring pipelines for 10 to 50 services delivered in 4 to 10 weeks, with built-in trace scrubbing and cardinality governance.
Evaluating observability vs monitoring? Get a scoped technical assessment in 48 hours and map your fastest path to production.
Conclusion
Observability vs monitoring is a practical decision that directly impacts MTTR, developer productivity, and infrastructure cost. Monitoring tells you when something fails, while observability explains why it failed and where to fix it. For distributed systems, both must work together with a clear intent. Monitoring handles alerts, while observability enables root cause analysis and faster recovery. Without this, teams repeat incidents and lose time debugging. If postmortems still end with uncertainty, it signals a gap in your stack. Talk to Patoliya Infotech to map your setup and build a production-ready observability system aligned with your scale and goals.
FAQs:
How much does it cost to implement observability for a mid-sized SaaS platform?
For a platform with 10 to 50 microservices, observability vs monitoring implementation typically runs $15,000 to $60,000. Open-source stacks carry higher engineering labor costs. Commercial software observability tools trade upfront engineering time for ongoing subscription costs. Patoliya Infotech delivers scoped estimates within 48 hours based on your specific service topology and team capacity.
Is observability the same as monitoring, and can I use both?
They are not the same. Monitoring detects failures through predefined thresholds. Observability vs monitoring in practice means running both simultaneously: monitoring for baseline alerting, observability with full distributed tracing for root-cause investigation. Most production systems with five services need both layers active.
How long does it take to implement full-stack observability?
A foundational OpenTelemetry setup with Prometheus and Grafana is operational in 4 to 8 weeks for 10 to 30 services. Enterprise rollouts with full distributed tracing across complex service meshes typically take 3 to 6 months. In observability vs monitoring, The variable is service count and instrumentation complexity, not tool selection.
What is OpenTelemetry, and why does it matter for observability?
A complete OpenTelemetry setup provides vendor-neutral SDKs and APIs for collecting logs, metrics, and traces. In observability vs monitoring, It prevents lock-in with any single software observability tools vendor and is natively supported by all major cloud providers. Teams that skip a standards-compliant OpenTelemetry setup typically spend more on migration later than they saved upfront.
What compliance or data residency risks exist when implementing distributed tracing?
Distributed tracing captures request-level data that may include PII depending on instrumentation depth. Teams under GDPR, HIPAA, or SOC 2 must implement trace scrubbing and sampling policies before collecting spans at scale. In observability vs monitoring, these controls belong in the OpenTelemetry setup design phase, not as a retrofit.
Can small engineering teams (under 10 engineers) realistically run observability?
Yes. Managed software observability tools like Grafana Cloud remove infrastructure overhead entirely. A team of five engineers can have a working OpenTelemetry setup with basic distributed tracing in two to three weeks using managed backends and pre-built collector configurations.