Table of Contents
TL;DR: Calculating workflow automation ROI comes down to three numbers only: hours saved, fully loaded labor cost, and total build cost. A simple Zapier workflow often clears its automation payback period within a month. A multi-step n8n build usually needs 4 to 6 months. Track both figures, never just one.
Finance leaders rarely reject automation because the technology fails; they reject proposals that lack a clear financial case. A successful demo may impress teams, but without measurable outcomes, cost savings, or payback timelines, approval decisions slow down.
Workflow automation ROI provides the missing calculation, helping businesses justify investments and prioritize automation projects that deliver measurable returns. This guide explains how to calculate workflow automation ROI using time savings, labor cost, and build cost, then applies that math to n8n, Zapier, and custom development so you can defend a business case with real figures.
Workflow automation ROI measures the financial return your business earns by replacing manual processes with automated workflows.
It is calculated by comparing total savings against all automation costs, including implementation, software licensing, integrations, training, and ongoing maintenance.
Look beyond hours saved by including labor costs, reduced manual errors, faster cycle times, improved productivity, and fewer operational delays.
Regular maintenance, workflow updates, and fixing broken integrations should always be included in the calculation, as these recurring costs affect long-term workflow automation ROI.
A complete and realistic workflow automation ROI calculation helps businesses justify automation investments, prioritize high-impact workflows, and make better decisions for future process improvement.
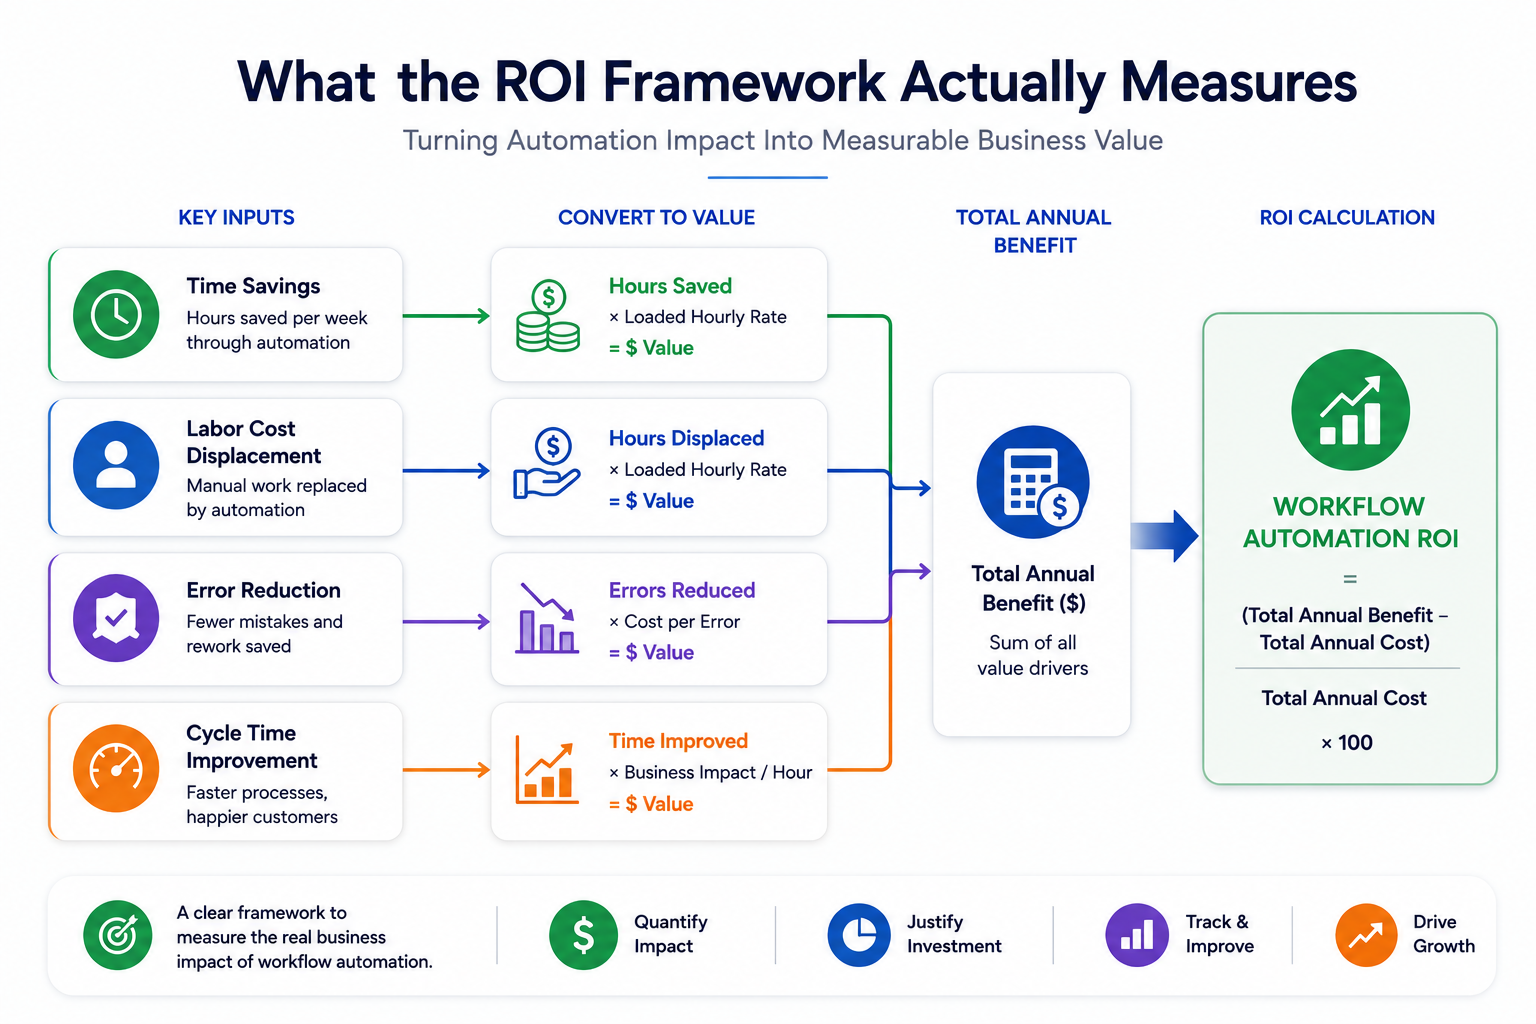
A workflow automation ROI framework tracks four process automation metrics together: time savings, displaced labor cost, error and rework cost avoidance, and cycle time value, then converts each into a dollar figure before totaling them.
Run those inputs through a single automation cost savings calculator so leadership sees one number, not four disconnected guesses.
Time savings calculation starts with a simple audit. Log how long a task takes a human today, log how long the automated version takes, and multiply the difference by weekly task volume. A 12 minute manual data entry task done 200 times a week becomes 40 hours saved once automated. Feed that number straight into your automation cost savings calculator so every later input stays consistent.
Displaced labor cost only counts once that time gets reassigned to higher-value work or removed from headcount plans entirely. If the freed hours sit idle, the workflow automation ROI on paper never shows up in the budget. A well-built automation business case presents a low, expected, and high range so the payback period holds up under finance scrutiny.
Manual processes carry a hidden error tax. Count the hours spent fixing mistakes today, price that time at loaded cost, and add it to the savings side of your automation cost savings calculator before finalizing any business case.
Faster cycle time has its own dollar value beyond labor. An invoice approved in two hours, not two days, improves cash flow and vendor terms, a benefit most teams forget to price into their automation cost savings calculator.
Run all four inputs through one automation cost savings calculator so leadership sees a single, defensible total, not four disconnected estimates.
Most flawed workflow automation ROI estimates share four root causes: an incomplete savings count, an underestimated build cost, a single point estimate with no range, and no owner tracking results after launch.
A proposal that lists only hours saved leaves real money on the table. Error avoidance and cycle time gains often add 20 to 30 percent more value on top of raw time savings, so a narrow business case understates the true workflow automation ROI.
Teams price the build hours and forget monitoring, credential renewals, and API changes that break connections. Add a maintenance line equal to 15 to 20 percent of the build cost per year to any automation cost savings calculator before presenting numbers.
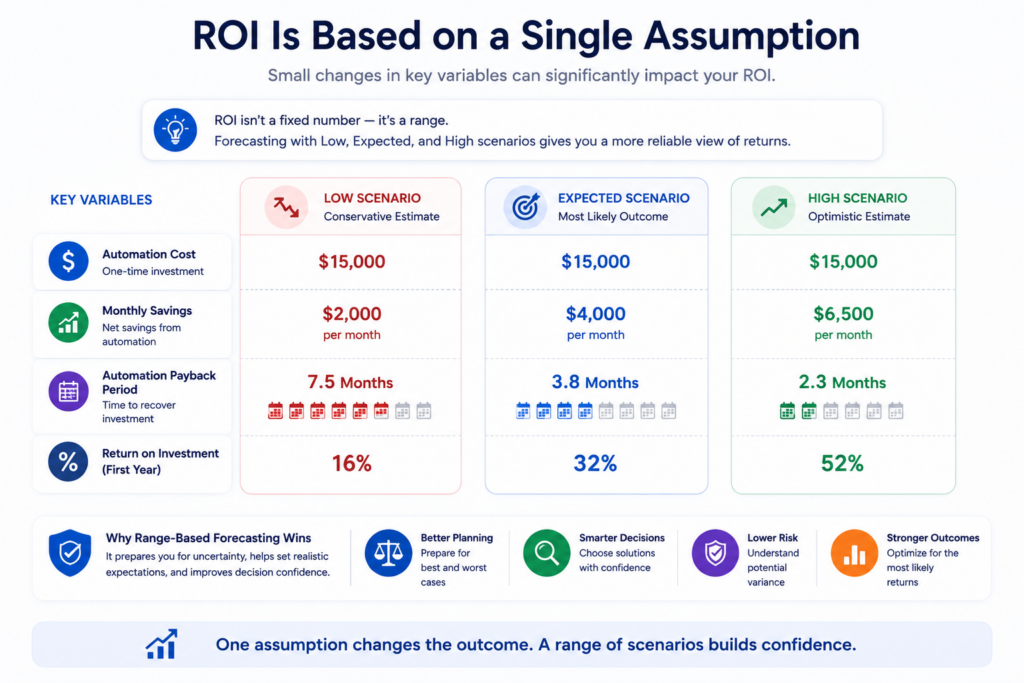
A single ROI figure invites pushback the moment one assumption changes. Present a low, expected, and high range instead, so the automation payback period holds up under scrutiny from finance.
The most common failure happens after launch, not before it. Assign one owner to check actual savings against projected savings at 30, 60, and 90 days, or the workflow automation ROI claim never gets validated at all.
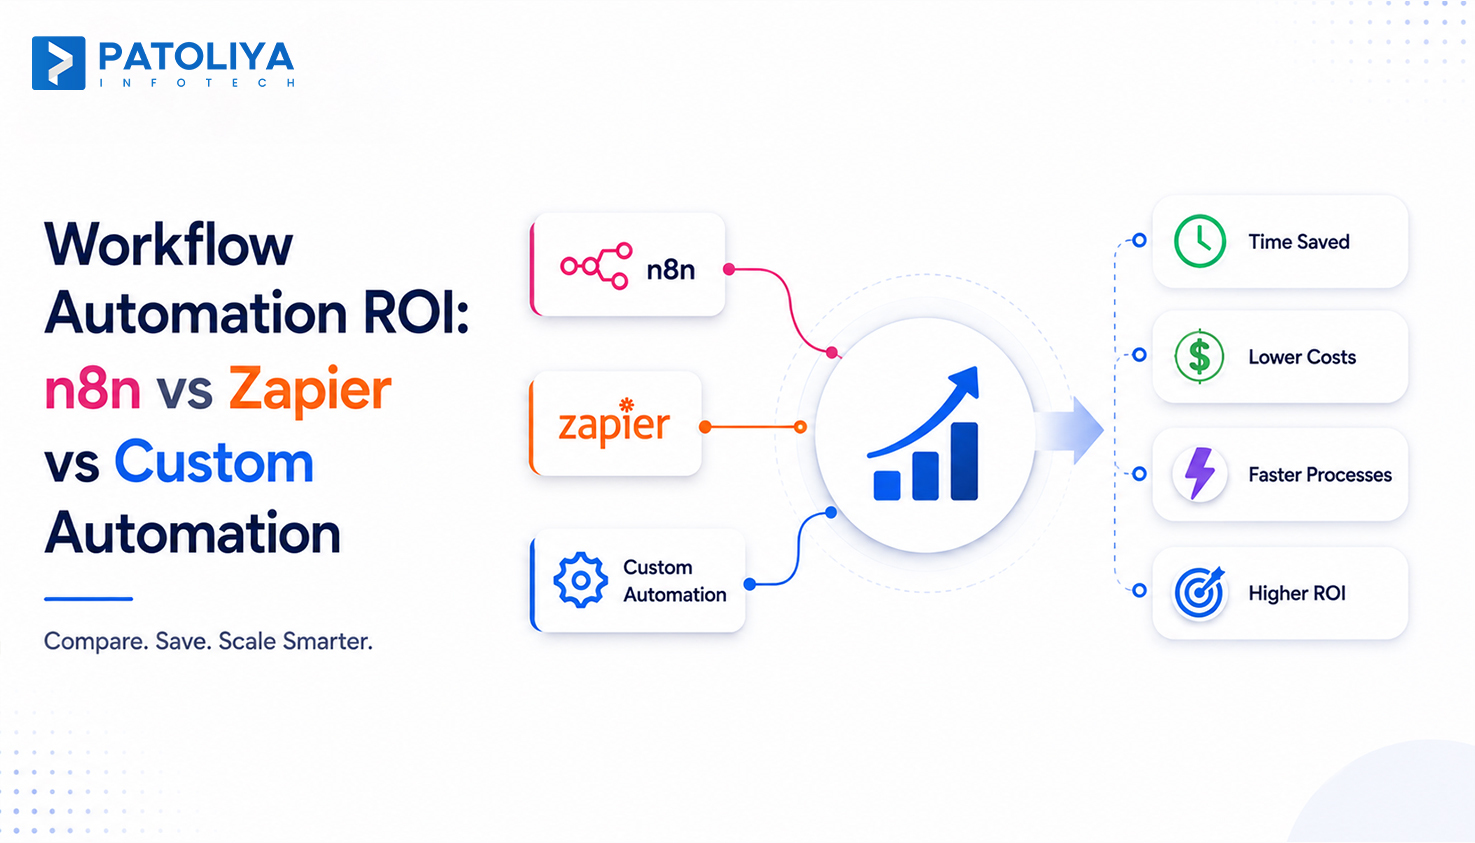
Platform choice changes the shape of the automation payback period more than any other variable, because Zapier front-loads cost into monthly fees while n8n and custom builds front-load cost into development time.
Zapier charges per task, so the cost scales directly with volume. n8n, run self-hosted, charges a flat server fee regardless of task count, which changes the math entirely once volume climbs past a few thousand tasks a month. Custom development carries the highest upfront cost but zero platform tax afterward.
Zapier wins the automation payback period race on low volume, simple workflows because setup takes hours, not weeks. n8n overtakes it once volume or complexity grows, since the flat hosting cost stops scaling with usage. Custom builds rarely win on speed but often win on total three-year cost for workflows tied to proprietary systems.
| Platform | Typical Build Time | Cost Structure | Best Fit for ROI |
| Zapier | 1 to 3 days | Per task pricing | Low volume, simple triggers |
| n8n | 1 to 3 weeks | Flat hosting fee | High volume, multi-step logic |
| Custom Build | 4 to 10 weeks | Fixed dev cost | Complex or proprietary systems |
A team running under 750 tasks a month usually sees a faster automation payback period on Zapier. A team running past 5,000 tasks a month almost always sees stronger long-term workflow automation ROI on n8n, since the per-task fee model on other platforms compounds quickly at scale.
Run both scenarios through the same automation cost savings calculator before picking a platform, since the crossover point moves with your own task volume, not a generic rule of thumb.
Get a scoped estimate comparing n8n, Zapier, and custom automation for your specific workflow.
Automation pricing splits into three clear tiers: simple single trigger workflows, multi-step workflows with conditional logic, and enterprise or AI augmented builds, each with a different automation payback period.
Simple Workflow Tier: A single trigger workflow connecting two apps, like a form submission creating a CRM record, typically runs a modest one-time build fee plus a small monthly platform cost.
This tier delivers the fastest workflow automation ROI because setup and testing take days, not weeks. Plug the numbers straight into an automation cost savings calculator, and the payback usually clears inside the first billing cycle.
Multi-Step Workflow Tier: Workflows spanning three to six apps with conditional branching cost several times more than a simple trigger, since testing every logic path takes real hours.
The payback period here stretches to a few months, but the ongoing savings compound as task volume grows, and every month past break-even adds directly to workflow automation ROI.
Enterprise or AI Augmented Automation Tier: Enterprise builds that pull in AI models for document parsing or decision logic carry the highest build cost and the longest automation payback period, often several months, but they also automate work that no simple trigger tool can touch.
Run enterprise projections through the same automation cost savings calculator used for simple builds, so the numbers stay comparable across tiers and the true workflow automation ROI does not get overstated.
Hidden Costs to Model Separately: Model API rate limits, credential rotation, and error monitoring as separate line items in your automation cost savings calculator. Skipping these three consistently shrinks projected workflow automation ROI once a workflow runs in production for a full quarter.
Contract Models: Fixed price contracts suit simple, well-defined workflows. Time and materials contracts suit multi-step builds where scope shifts once real data reveals edge cases the discovery call missed.
A well-built automation business case ties every cost line to a savings line so leadership can see the workflow automation ROI and the automation payback period on one page.
Simple workflows show measurable value within two weeks of go-live. Multi-step and enterprise builds need a full billing cycle, usually a month, before the workflow automation ROI picture stabilizes and outliers get smoothed out. Update your automation cost savings calculator at each of these checkpoints. Do not wait for a single year-end review.
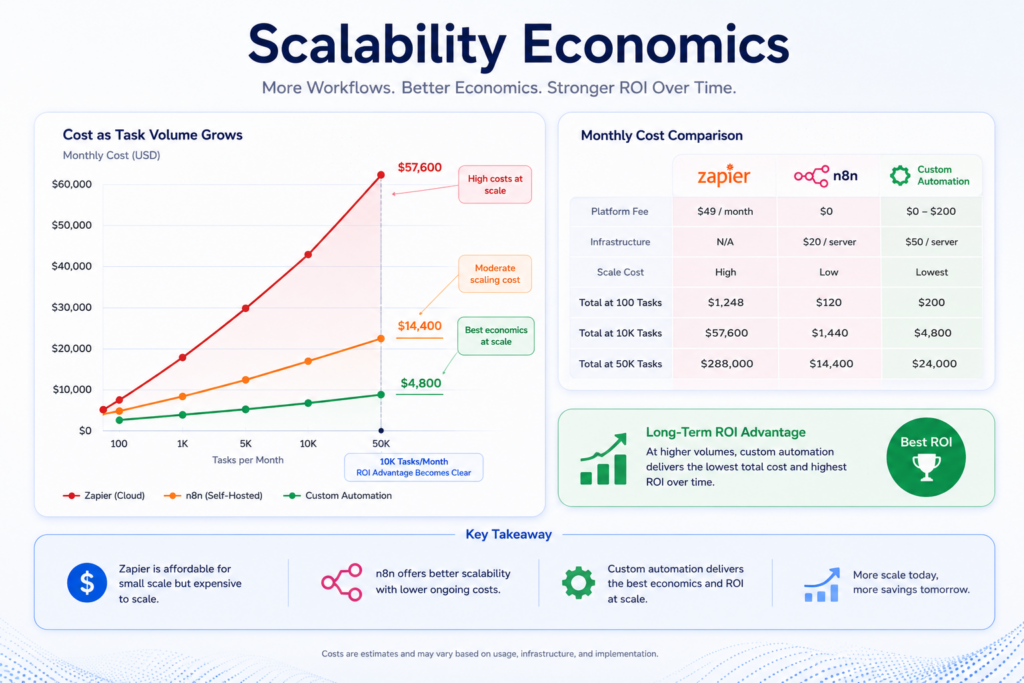
Scalability economics changes how automation cost comparison works across platforms as volume grows. A workflow priced well at 1,000 tasks a month can become expensive at 10,000 tasks if the platform charges per task, which is exactly why the automation payback period must get recalculated at each growth stage, not set once and forgotten.
For instance, a 20-person operations team spends 25 hours a week on manual data entry at a loaded rate of $ 35 an hour. That is 875 dollars a week, or roughly 3,500 dollars a month, in labor cost alone.
A multi-step n8n workflow built for 6,000 dollars, with 150 dollars a month in hosting and maintenance, breaks even in under two months and keeps generating the same workflow automation ROI every month after that. That worked example is the exact math every workflow automation ROI proposal should show before asking for budget.
Four risks consistently erode projected ROI from workflow automation after launch: unclear data ownership, communication gaps with a vendor, thin testing coverage, and restrictive exit terms in the contract.
IP and Data Ownership Risk: IP and data ownership risk means you must confirm who owns the workflow logic and the data flowing through it before signing anything. Vendors that retain ownership of custom logic can hold your automation payback period hostage the moment you want to switch providers.
Communication and Timezone Risk: Communication and timezone risk from offshore teams working opposite hours slows bug fixes, quietly stretching the real payback period past the number in the original proposal and drags down monthly workflow automation ROI while the fix sits in a queue.
Quality and Testing Risk: Thin testing before going live means broken workflows surface in production, where a single failed run can cost more in cleanup than the workflow automation ROI it generated that month.
Contract and Exit Risk: Contracts without a clear handoff clause trap teams with a vendor even after the relationship sours, since rebuilding a workflow from scratch resets the entire payback period to zero and erases any workflow automation ROI already booked.
| Evaluation Criteria | Why It Matters |
| Technical Expertise | Ensure the vendor has proven experience with your technology stack, business processes, and workflow complexity to reduce implementation risks. |
| Transparent Pricing | Look for clear implementation, licensing, and maintenance costs to accurately forecast workflow automation ROI and avoid hidden expenses. |
| Testing & Quality Assurance | A documented testing process minimizes deployment issues, reduces downtime, and improves workflow reliability after launch. |
| IP & Ownership Terms | Confirm ownership of workflows, integrations, and documentation to avoid vendor lock-in and maintain long-term flexibility. |
| ROI Measurement Process | The vendor should have a structured approach to tracking workflow automation ROI using KPIs such as cost savings, cycle time, and error reduction. |
| Relevant Customer References | Request case studies or references from businesses with similar workflow volumes to validate real-world performance and ROI claims. |
| Maintenance & Support Plan | A fixed-cost maintenance agreement helps control ongoing expenses and prevents unexpected costs from reducing automation returns. |
| Performance Reporting | Regular dashboards and post-launch reviews ensure workflow performance is continuously monitored and optimization opportunities are identified. |
At Patoliya Infotech, we ensure workflow automation delivers measurable business value. Every engagement begins with a detailed ROI assessment, helping you understand the expected savings, efficiency gains, and payback period before development starts.
Book a technical discovery call with Patoliya Infotech to receive a customized workflow automation ROI assessment and a practical roadmap before investing in automation.
Workflow automation ROI is only valuable with clear numbers, realistic timelines, and measurable business outcomes. Selection of the right automation platform, implementation approach, and long-term maintenance strategy directly affects how quickly your investment pays for itself. Instead of relying on assumptions, calculate the expected savings, productivity gains, and payback period before development begins. This allows you to prioritize the workflows with the highest impact while minimizing implementation risks.
Ready to invest with confidence? Schedule a technical scoping call with Patoliya Infotech to model your workflow automation ROI, identify the best automation opportunities, and receive data-driven projections before you commit your budget.