Table of Contents
The healthcare dashboard portal is not primarily for reporting, but provides an overview of all data with analytics to help with decision-making.
Consider that numerous departments generate thousands of data points and are constantly producing more. If an expert has to make a choice, they must consider other departmental criteria. Obtaining information from numerous departments and teams that are unsure whether the data is complete or not. After receiving final insights, things become even more complicated.
The healthcare dashboards portal provides a unique view, helping in the visibility of each department. Every data point is presented in an easily scannable format, allowing for quick improvement actions.
A healthcare dashboard portal combines data from several departments and platforms. This data can be both historical and real-time, and it contains information about clinical performance, operational efficiency, and financial health. This helps to guide decisions, prioritise tasks, and boost staff productivity.
Clinical dashboards are designed with patient care in mind. To enable experts and the team to take immediate action, they provide real-time vital signs, risk scores, alerts, and care status. These dashboards are useful in critical care settings, intensive care units, and remote patient monitoring, when timing is crucial.
Operational dashboards emphasize the hospital's operational efficiency. Metrics include bed occupancy, ICU capacity, staffing availability, and patient flow. This assists administrators and operations teams in managing resources, reducing delays, and maintaining daily operations.
Financial and Revenue Dashboards provide insight into the organization's financial situation. Finance and revenue cycle teams can identify problems early and stop revenue leakage through tracking billing performance, claims, denials, reimbursements, and cost data.
Executive dashboards provide a high-level and clear image of performance for leadership. These dashboards help CXOs to track results, KPIs, and long-term trends across departments without getting into operational specifics.
ICU dashboards are designed for intensive care, where every moment counts. They prioritize notifications for quick clinical intervention, manage high-frequency data, and track vital signs in actual time. The layout helps experts to focus on the most urgent issues without being distracted.
Ward dashboards have a moderate data frequency and run more slowly. They emphasize early warning signals and trend-based monitoring. This method assists care teams in identifying patterns of decline and taking action before circumstances worsen.
Dashboards for home monitoring use noisy and low-frequency patient data. They concentrate on proactive interventions, compliance, and long-term trends. This helps Remote care teams to help patients manage their health from home and detect problems.
A single healthcare dashboard portal design cannot effectively support every setting. ICU alerts and images have the potential to overburden ward workers and set off false alarms at home. For this reason, dashboard design should be based on the clinical setting. It ensures that insights are accurate, relevant, and useful for every care setting.
Electronic Record Systems: Provide complete patient data, including clinical notes, medications, medical history, and demographics for clinical decision-making in dashboards.
Imaging and lab systems: Provide lab findings, imaging reports, and diagnostic results for monitoring patient progress and strengthening evidence-based treatment.
Bedside monitors and medical equipment: It gathers continuous monitoring data, device measurements, and real-time vital signs. This is especially true in critical settings like emergency rooms and intensive care units.
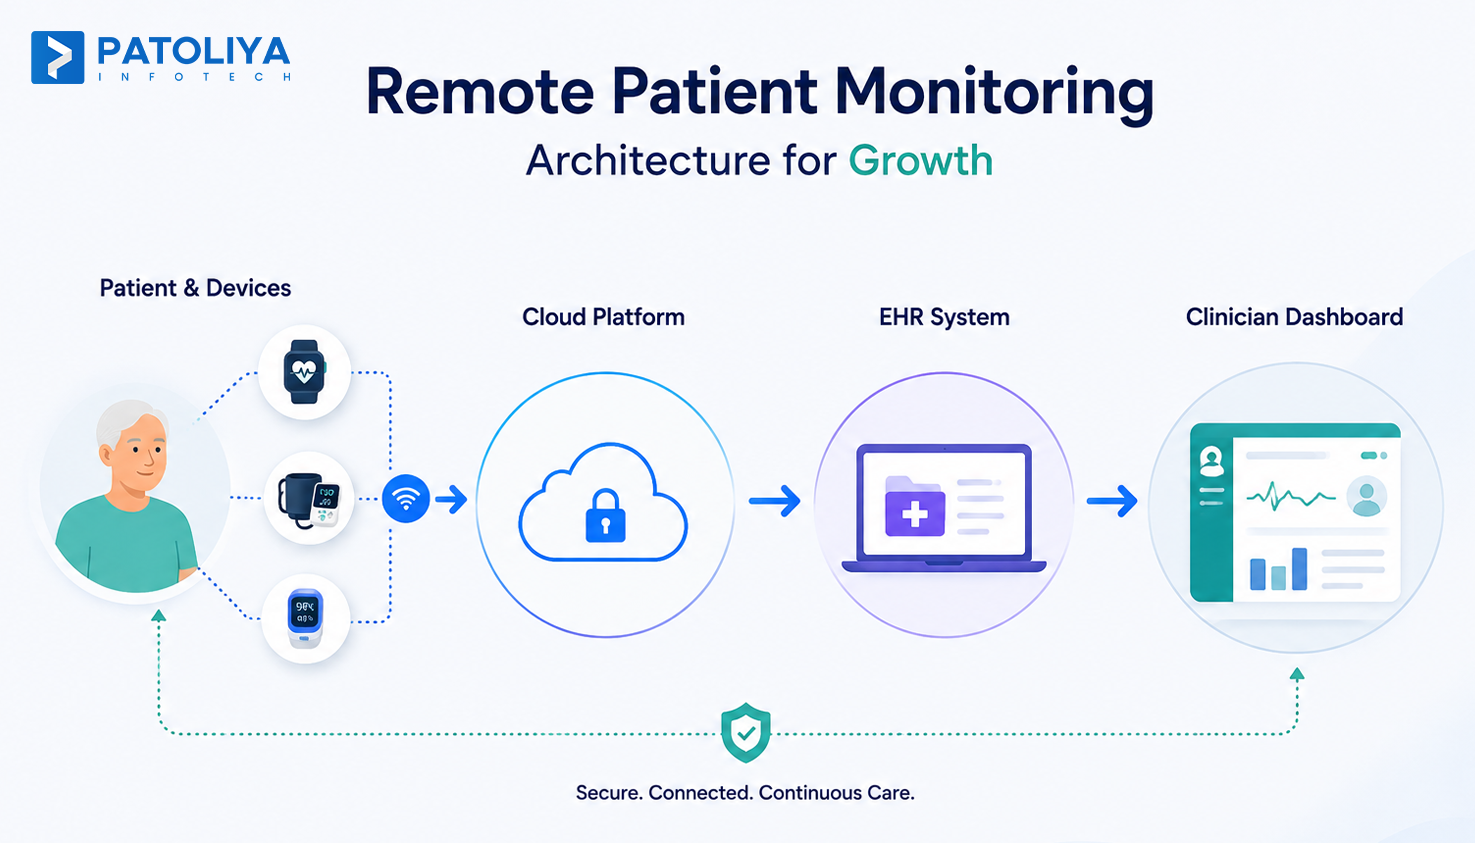
Wearable Technology and Remote Patient Monitoring: Provide long-term data from sources outside the hospital, including vital signs like heart rate and activity. This leads to remote patient involvement and proactive therapies.
Administrative Systems and Claims: Integrate operational, staffing, insurance, and billing data to enable administrators to monitor performance, maximize resources, and maintain compliance.
| Design Area | Practical reality and what actually works | Practical example |
| The initial screen experience | There is not enough time for clinicians to investigate dashboards. The first screen, which is automatically categorized for risk and recent changes, must show who needs attention immediately. | A list of the top 5 patients whose risk score worsened overnight appears on the dashboard during morning rounds. |
| Flow of Navigation | Care is slowed down when vital signs, lab results, and notes are switched between. Dashboards that work well combine important signals into a single patient view. | Without opening numerous displays, a nurse examines warnings, recent lab results, and vital trends from a single row. |
| Awareness of Data Quality | When healthcare dashboard portals are unable to verify the accuracy of the data, clinicians become doubtful of them. Time stamps that are visible boost confidence. | A doctor uses the dashboard during quick response when they see Updated 2 mins ago next to vital signs. |
| Interpretation of Trends | Raw numbers lead to cognitive strain. Visual prioritization using color intensity, arrows, and icons to immediately signal deterioration, recovery, or stability. | A patient gets marked Worsening over the last 6 hours in place of 10 vital signs. |
| Alerting Behavior | Continuous notifications cause exhaustion. Alerts should be triggered when patterns persist, and the risk worsens. | Alerts are sent to a ward nurse in response to persistently unusual readings and not for every slight variation. |
| Exchange of Shifts | During shift changes, important changes are frequently overlooked. Dashboards need to showcase recent developments. | Two patients who have become worse have a new marking since the last shift marking. |
| Awareness of Care Settings | Different reasoning is needed for ICUs, wards, and step-down units. Dashboards need to change on their own. | On the ward, clinicians watch how the patient’s condition changes over time, but in the ICU, even small deviations trigger action. |
| Role-Based Perspectives | Coordinators, physicians, and nurses respond to diverse signals. Role priorities need to be reflected in dashboards. | While doctors observe progression signs and diagnostic trends, nurses receive task-focused notifications. |
| Actionability | Unguided insight causes treatment to be delayed. At the point of attention, dashboards need to recommend the next course of action. | High-risk notifications include things like Activate the rapid response team and Prepare for ICU transfer. |
| Trust Throughout the Time | Clinicians stop using dashboards that provide alerts all the time. Dashboards that are quiet gain credibility. | For stable patients, the dashboard remains silent, giving notifications significance when they show up. |
| The Cognitive Load | Burnout results from the diagnosis of dozens of patients. Systems need to set priorities. | Clinicians pay attention to the important patients during a hectic shift. |
| Adoption Results | When a healthcare dashboard portal is forced, it fails. Saving time is what makes them successful. | Clinicians check the dashboard first because it makes their jobs easier, not because it is required. |
| Aspect | Reporting Dashboards | Real-Time Monitoring Dashboards |
| Primary purpose | Clinical, operational, or financial performance from the past is reviewed and summarized using reporting dashboards. | In live care environments, continuous monitoring dashboards are intended to facilitate prompt and crucial decisions. |
| Focus on Time | These healthcare dashboard portal help teams comprehend past events by looking backward. | These dashboards highlight current events and issues that need to be addressed. |
| Frequency of Data Refresh | Data is updated regularly, usually every hour, every day, and following the conclusion of an event. | Data is updated every few seconds and minutes. |
| Clinical Effects | Although they rarely immediately alter patient outcomes, reporting dashboards facilitate analysis, audits, and performance assessments. | Monitoring dashboards allow for quick clinical intervention, which has a direct impact on patient outcomes. |
| Common Use Cases | They are used for retrospective analysis, compliance monitoring, and quality reporting. | They track patient status and identify worsening early in ICUs, wards, and home monitoring. |
| Response to Risk | These dashboards are designed for decision-making at low to moderate risk. | These dashboards function in high-risk settings where delays can be harmful. |
| Behavioral Alerts | Reporting dashboards don't produce notifications and alerts. | Monitoring dashboards utilize context-aware notifications to flag patients and situations that need intervention. |
| Timeline for Decisions | Decisions based on reporting dashboards are made over several days and weeks. | Monitoring dashboards are used to make decisions in a matter of seconds, minutes, or hours. |
| Adaptability in Care Settings | Regardless of the care environment, reporting dashboards often don't change. | Monitoring dashboards, modify data frequency, limits, and logic for ICU, ward, and home settings. |
| The entire value | Reporting dashboards facilitate accountability and governance and offer an explanation of performance. | Healthcare Dashboard portal for real-time monitoring reduce response times and decision delay. |
Clinicians can quickly determine which patients require care with AI and machine learning. The dashboard focuses on risk scores, priority patients, and early warning indicators.
Vital signs, test findings, and clinical events are continuously analyzed using machine learning. this identify concerning patterns that would not be obvious during inspection.
Predictive insights that are integrated notify care teams of possible decline early on. This supports quick decision-making and action.
Security and regulatory compliance are crucial as healthcare dashboards handle sensitive patient data. this including HIPAA, GDPR, and local legislation. Role-based access control lowers risk by letting users view information related to their role. Track action for accountability and compliance using audit trails and data traceability.
Dashboards need governance, just like EHR systems, because they have an impact on clinical decisions. The accuracy, dependability, and safety of insights for patient care are ensured through clear ownership, established policies, and oversight.
Healthcare decision-making dashboards need to be handled and regulated like essential healthcare systems with built-in security, privacy, and accountability.
Seek out suppliers who have effectively deployed dashboards in actual clinical settings. The platform's ability to manage complicated patient data is ensured by its experience in hospitals, intensive care units, wards, and home care. It supports clinical decision-making and integrates with many systems.
The healthcare dashboard portal should have standards like HL7 and FHIR. This helps to integrate with EHRs, labs, imaging systems, and other clinical applications. A unified vision of care happens with interoperability, which ensures that patient data moves between systems without interruptions.
Dashboards need to be seamlessly integrated into current healthcare workflows. For instance, a nurse's regular patient visits should include alarms and trends. Predictive risk scores need to be available to doctors straight from the EHR interface. This ensures that insights motivate action and enhance adoption.
Governance and regulatory compliance are essential. The platform needs to offer audit trails, role-based access control, and regulatory support systems. Vendors need to have EHR-like governance structures. This ensures the complete accountability and auditability of dashboards that impact healthcare choices.
The dashboard must adjust to various care settings.
For instance:
Ward: Trend-based observation to spot slow decline.
ICU: Stricter standards for immediate alerts.
Home care: Telehealth integration and remote monitoring with patient-friendly notifications.
This adaptability ensures that the same platform can efficiently handle the entire care journey.
Clinical Intervention Time: How fast medical professionals can recognize high-risk patients and take appropriate action to improve outcomes.
Decrease in Adverse Events: Whether mistakes, issues, or patient decline can be avoided with the dashboard.
Gains in Operational Efficiency: Workflow improvements include shorter data collection times, fewer unnecessary tests, and seamless communication.
Clinician Trust and Adoption: Clinicians must regularly use the dashboard and have faith in its insights for it to be truly successful.
Healthcare dashboards are becoming flexible and adaptable systems that display important patient data according to care situations. Vital signs, lab results, imaging, and clinical events are all integrated into multimodal data. They identify patterns that are difficult for humans to recognize.
Dashboards can forecast decline, recommend therapies, and optimize healthcare workflows with generative AI and decision assistance. In the end, they lead to proactive, intelligent treatment, assisting physicians in predicting dangers and enhancing results along the path of care.
Different departments in the healthcare industry want data at different speeds and with varying levels of urgency. The clinical infrastructure determines the interpretation of this data. Role-aware and context-driven dashboards are essential as care delivery spreads to homes, hospitals, and outpatient settings. Real-time signals are necessary for clinicians.
Operational visibility is necessary for administrators. Executives rely on insights at the system level. These requirements are connected via a single decision surface in a well-designed dashboard portal.
Healthcare Dashboard Portals reduce cognitive burden, focus on what matters in the present, and are seamlessly integrated into existing healthcare workflows. With effective governance, security features, and AI, early intervention and better coordination are made possible, and standardized outcomes are achieved.
The right kind of development partner is crucial because their experience determines the quality of the infrastructure and technology. Choose Patoliya Infotech with a track record of excellence in this area. We provide technology that integrates seamlessly with workflows and delivers long-term value.